A project stakeholder’s guide to understanding numbers
Project controls processes and project reports are full of numbers and calculations and one would think that most project stakeholders, particularly senior managers, would see and understand the numbers in the same way.
Unfortunately recent research suggests this is not the case: many people have real difficulty understanding and interpreting numbers.
Try a few quick tests for yourself; what is the correct answer to these simple problems?
Q1: 1 + 1 + 1 x 0 + 1 = ___
Q2: If a bat and ball cost $1.10, and the bat costs $1 more than the ball, what is the cost of the ball?
Q3: Your project has identified a major opportunity, your sponsor can choose to use the opportunity to realise 50% more benefits at no additional cost or realise the planned benefits for half the original budget. What should you recommend as offering the best cost outcome, delivering 50% more for no extra cost or saving 50% of the project budget?
The answers are at the end of this post.
Most people are bad at percentages and many are not so good with numbers—this includes your stakeholders. Question 3 was balanced 50% more versus 50% savings and most people will choose incorrectly. Offer the average manager a choice between 50 percent more product per dollar and a 35 percent price reduction, and almost everyone will pick 50 percent more volume, thinking that it’s a better deal. It is not. The 35 percent cost reduction leads to a 54 percent improvement in price per unit of volume whereas the 50 percent benefit increases only leads to a 50 percent improvement in unit price.
Make the decision more complex and the error rate increases. Try ranking the following printers by speed (pages per minute).
- Printer 1: Prints 50% more pages per minute than your previous printer.
- Printer 2: Takes 45% less time to print each page than your previous printer.
- Printer 3: Prints 40% more pages per minute than your previous printer.
- Printer 4: Takes 35% less time to print each page than your previous printer.
Answer: The correct order, from fastest to slowest, is: printer #2, printer #4, printer #1, then printer #3.
Pierre Chandon, the L’Oréal Chaired Professor of Marketing, Innovation, and Creativity at INSEAD, asked 400 people to imagine they are setting out to purchase a new printer to replace an old one, which printed 25 pages per minute (ppm). When the rate (25 ppm) was included in the question, 57 percent of participants provided the correct ranking (43% got it wrong), but when rate information was absent, only 8 percent ranked the printer accurately.
Throughout these experiments, the testers observed that the numeracy skills of the people being tested impacted the results. People who got at least one correct answer in the ‘quick test’ above were more likely to find the correct answer to the more complex questions discussed in the narrative. But how can you test the numeracy of your stakeholders?
Numbers are a language
The worrying question for project controls professionals, PMO staff and project managers in general is, if these results focused on ‘consumers’ translate across to your project stakeholders (after all they are all ‘consumers’) how many interpretation errors are made assessing business case data and summary project progress information?
A part of the solution is recognising that numbers and percentages are just another type of language, and any language needs learning and, if you want other people to understand your particular language, teaching. You need to take the time to ensure your core messages are understood before expecting informed decisions from your stakeholders. For more on this see Dr Lynda Bourne’s paper on ‘obtaining informed consent’, it was written for engineers, but has wide application in all project domains.
The rest is basic communication; the next time you develop a business case or project report in any format, try thinking about the information it contains from your audience’s perspective, how much (and what) do they really understand, and what do you need to do to achieve the level of understanding you need?
_______________
The answers:
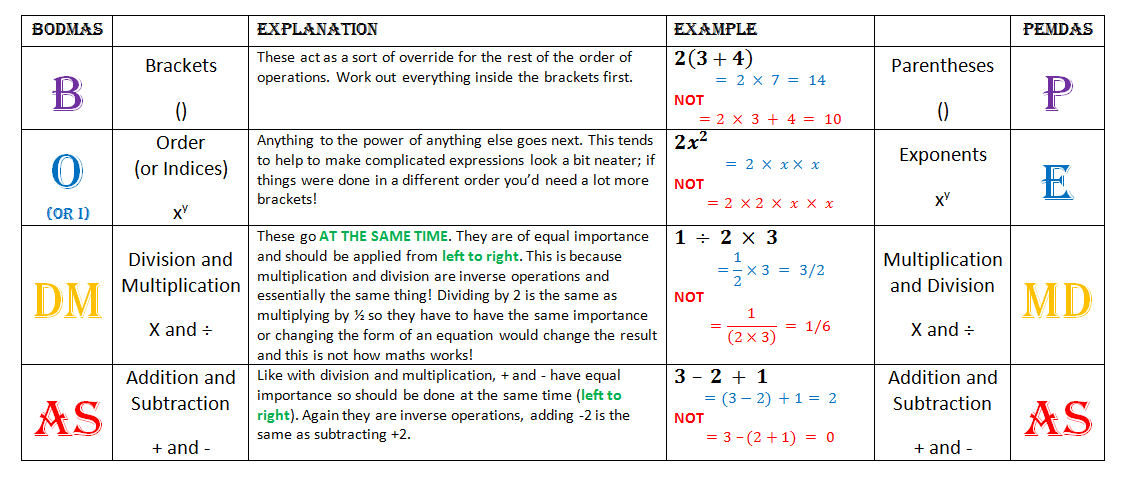
Q1: The answer is 3 (not 1) the order of applying processes is defined by BODMAS (PEDMAS in the USA):
Q2: The ball costs 5 cents (not 10)
Q3: Most people will choose the 50% increase in production but this is not the best option:
—Current plan is to make 10 units at $20 each, cost per unit = $2
—A 50% cost reduction reduces the cost per unit produced to $1 each
—A 50% increase in quantity produces 15 units for $20 = $1.33 per unit
Note: this was a cost question, not a benefits realised/value question.
