Are your project decisions based on statistical uncertainty?
Statistics drive decisions in every walk of life, including project management. One of the applications of statistics we’ve been exposed to more than once recently is answering the question how many meals to load on a Qantas flight?
Qantas economy cabin seats roughly 300 passengers, dinner has 3 choices on the menu, should the flight load 300 meals distributed by the expected choice (updated based on learned experience) or more? If only 300 meals are loaded, some people at the end of the service may not get their first choice. Is it worth adding a few extra meals to minimise this effect or just allow for the fact some people will not want anything and those who miss out will not be too disappointed?
Business class is somewhat different: 5 choices, 80 passengers and running out of any option is unacceptable! Load 400 meals and waste 320, or use statistics to balance the load but maintain an acceptable level of service, meeting every passengers request most of the time?
The newly emerging trend to encourage business class passengers to pre-order meals looks like enhanced customer service but has the additional benefit of reducing uncertainty and therefore reducing the amount of meals waged, and the associated costs…
Even without this enhancement, statistics can be used to predict the optimum distribution of meals to load depending on the accepted level of failure. This is a serious business question, a few additional meals will be needed to provide a 90% certainty of meeting every request; more meals will be needed to raise the success rate to 95% (with increased wastage) but most of the profit comes from repeat full-fare business passengers and these people like to be pampered.
What does this have to do with projects? Similar situations occur during testing and commissioning on any complex system. The fact there will be failures is a given, the number and type are variables, as are the different skills needed to fix the problems. Having insufficient people or the wrong skill mix delays the commissioning process, having too many costs money in wasted time. But even with the best analysis, probability and randomness will affect statistics.
Why do we reward false certainty?
The starting point is that every measurement and every test is subject to a degree of random error, and this includes processes that produce a single value such as the grading of an assignment by a lecturer. The grade is not a statement about the assignment; it is a measurement of the assignment. The measurement is subject to error and may also be subject to bias.
One of the paradoxes of modern life is that while every measurement carries a degree of uncertainty, the uncertainty of the measurement is rarely discussed when the measurements are quoted. People like to pretend the apparent certainty of a single value estimate translates into something real. They reward people who state a single wrong number as the ‘estimate to complete’ (e.g. the cost will be $345,000) and question the competence of someone who provides a 95% sure range estimate, (e.g. there’s a 95% probability that the cost will be between $340,000 and $360,000). The chances of the cost outcome being precisely $345,000 approximates zero!
The simple fact is, all measurements, tests and subjective assessments carry varying degrees of random error. The challenge is to determine a ‘true value’ from the measurements and also, given a limited set of measurements, assess the probability that our determination is correct. One way to produce a single value from a discordant series of measurements is to simply take the average (mean) of the values, but this approach needs several independent sets of measurements to be of use, for example five separate people marking an assignment. In many situations this is not possible.
To overcome this problem, the theory of measurement is based on the precept that the distribution of errors in any set of measurements follows a universal law and consequently, given certain common conditions, the determination of a true value based on a set of measured values can be solved employing a single mathematical analysis.
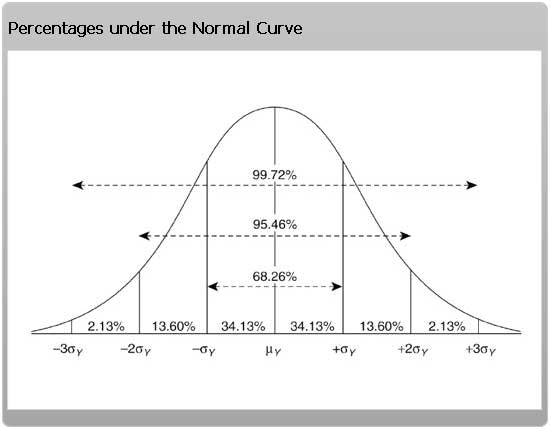
The solution is a normal distribution curve which is defined by two parameters, its peak (height) and the amount of spread in the curve (its standard deviation). In a set of data that follows the normal distribution, about 68% of the observations will fall within 1 standard deviation each side of the mean, 95% within 2 standard deviations and 99.7% within 3 standard deviations.
The first factor to take from this theory is that assuming a single point measurement represents the real value is dangerous! Single data points or a very limited sample are common in project management and very often the only information available to help us make a decision. While something is better than nothing, it is important to remember this data is only one point from under the overall ‘bell curve’ of possibilities and you cannot tell if it represents the mean or an outlier.
By 1830, the scientists involved in developing these theories had generally accepted three basic principles:
- The law of large numbers, which is that the average of the results obtained from a large number of trials should be close to the expected value (mean), and will tend to become closer as more trials are performed.
- The central limits theorem, where the probability that the sum of a large number of random independent values will take on any given value is distributed according to the normal distribution.
- The ‘error law’, which is defined by the normal distribution curve and Standard Deviation.
The patterns of randomness in social data are so reliable that their violation can be taken as evidence of wrongdoing as most project measurements are social in nature, affected by the actions of people. Unfortunately what’s missing is a willingness to invest in obtaining enough measurements to be able to apply these laws.
The key message from statistics is one measurement or estimate may ‘feel good’, there is an illusion of certainty, but the single point measurement is unlikely to represent reality. It is more likely to be wrong than right!
